Relatively recently, a new player came to the eye-tracker market. It introduced the EyeTribe tracker: a portable eye tracker with a never-seen-before price tag of $100. This is suspiciously cheap, so I set to find out if the tracker was any good at all.
TL;DR
The EyeTribe tracker is really cheap, and you can now use it in Python and in Matlab. It’s not as bad as you would expect from its price, and you could probably use it in fixation or pupillometry studies. I highly advise using a chin rest, though.
(TL;DR stands for Too Long; Didn’t Read. Interweb nerds tend to write this if they feel a post is too long to read, mostly due to their low attenshun span. A TL;DR in a post provides a short summary.)
EyeTribe in Python and Matlab
The EyeTribe comes with a Software Developers Kit (SDK) and tutorials for three programming languages: C#, C++, and Java. Although I have some experience in C++, I’m not fluent in any of these three languages. So I decided to write my own wrapper to be able to interface with the EyeTribe via Python (my favourite language). This was easy enough, due to the incredibly brilliant API. The result was [PyTribe](https://github.com/esdalmaijer/PyTribe), which I quickly integrated into PyGaze. (If you want to use the EyeTribe tracker with PyGaze, simply set the TRACKERTYPE to ‘eyetribe’.)
In addition, I dusted of my Matlab installation and programmed a simple EyeTribe Toolbox for Matlab. Although I wrote it to benefit my own lab, none of the lab members are currently using it (we prefer the beefier EyeLink 1000). That doesn’t mean my efforts went to waste: people from other labs in my department are putting it to good use, and I’ve received emails with questions and/or thanks from people all over the world. In fact, UCL postdoc Benjamin de Haas helped me debug a few timing issues, and Cambridge PhD Jan Freyberg (@JanFreyberg) improved the calibration routine.
Put It To The Test
Once I could communicate with the EyeTribe via PyGaze, I could start comparing it with other trackers. My first idea was to create a setup in which participants’ eye movements were recorded simultaneously by three trackers: the EyeLink 1000, the SMI RED-m, and the EyeTribe. The EyeLink 1000 is a powerhouse that sports a 1000 Hz sampling rate and a high accuracy and precision, arguably the best video-based eye tracker out there. The RED-m is a portable eye tracker manufactured by SensoMotoric Instruments, with a slightly higher sampling rate (120 Hz) and comparable accuracy and precision to the EyeTribe.
It’s not easy to script a combined calibration and recording for three different eye trackers. Seriously, it’s not. In the end, I managed to do it, though. Only to realise that it was an absolute disaster. The EyeLink 1000 works with a single source of infrared light, whereas the RED-m and the EyeTribe work with two sources. It turns out that the amount of light sources is crucial to the algorithms of each tracker. (Eye trackers work by comparing the position of the pupil with the position of one or more glints: reflections of the infrared light sources on an eyeball.)
So simultaneous recordings were out of the question. That is a huge setback: if you want to do a proper, direct comparison of two tracker, you should really do it on the exact same eye movements. The second-best alternative is to test each tracker on the same participants in two consecutive recordings. So that’s what I did! For various practical reasons, I decided not to use the RED-m, but to compare only the EyeTribe and the EyeLink 1000. The aim was simple: to see how the EyeTribe would hold against the industry standard. (Obviously, I did not intend to make the point that an EyeTribe could perform just as good as the EyeLink, but just to see whether it would be good enough for scientific studies.)
Results
I decided to run a few short experiments that could test the basic eye-tracking metrics: point-of-regard estimation accuracy and precision, saccade trajectory and velocity, and changes pupil size. All tests and their results are explained below. I tested 5 people, who each did all of the experiments twice: once with the EyeTribe and once with the EyeLink 1000. Of course, the order of trackers was counterbalanced (some started with the EyeLink, some with the EyeTribe).
Simple Validation
The point of regard is where you look on the monitor. If you show a single dot, and a participant is looking at that dot, you want the eye tracker to report that the participant is looking at the dot. However, for various reasons, eye trackers suffer from measurement errors. These can be systematic: the tracker could always report that a participant is looking to the top left of the dot. The amount of systematic error is referred to as the accuracy of an eye tracker.
In addition, trackers suffer from random noise. When a participant is looking at a dot, the tracker might sometimes report that the point of regard is to the top left of the dot, or to the top right, or just below the dot etcetera. This type of noise is not systematic, but completely random. The less random noise, the higher a tracker’s precision is.
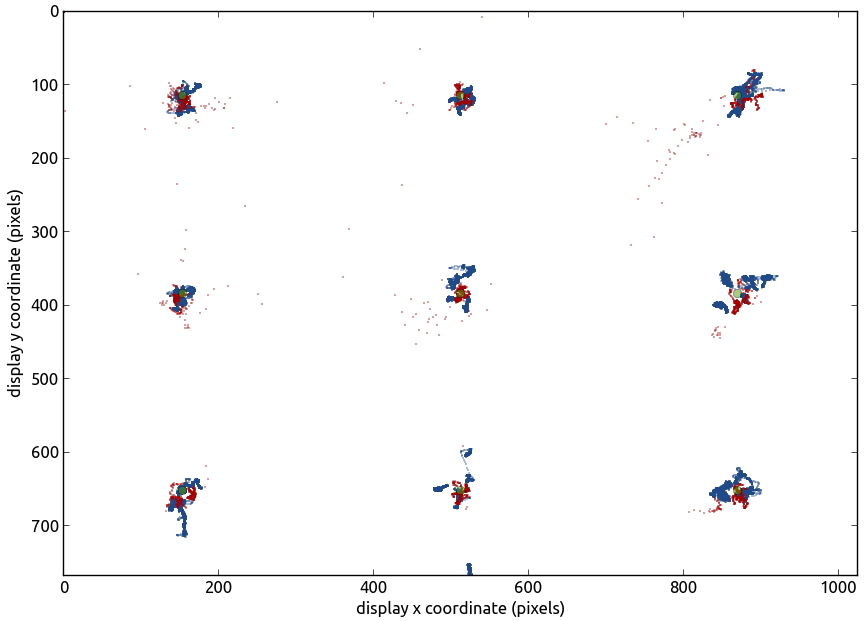
If you look at a plot of all samples (red and blue dots in the graph) obtained during the validation, you see that they are spread around nine points (green dots in the graph). These were the locations at which one dot at a time was visible. The larger the difference is between the actual point and the centre of the cloud of samples, the lower the accuracy. The larger the spread is of each cloud of samples, the lower the precision. If you quantify the results, the EyeTribe has a horizontal accuracy of less than 0.1 degrees of visual angle. (Degrees of visual angle are units that experimental psychologists use to indicate the amount of space on the retina that is cover by a stimulus.) The vertical accuracy is almost four times as large (the horizontal accuracy usually is better than the vertical). This is a pretty decent performance!
The precision is even better: less than 0.01 degree of visual angle, both horizontally and vertically. There are a few important things to note here, though. First, the test was performed under ideal conditions in a lab without light interference and with a chin and forehead rest. You will never get values close to this if you don’t use a chinrest. Secondly, the test was performed directly after calibration: when the tracker is expected to perform at its best. The longer your task lasts, the more drift you will see in your measurements, and thus the less accurate they become. I have no data on how quickly the EyeTribe’s calibration deteriorates.
Fixation Analysis
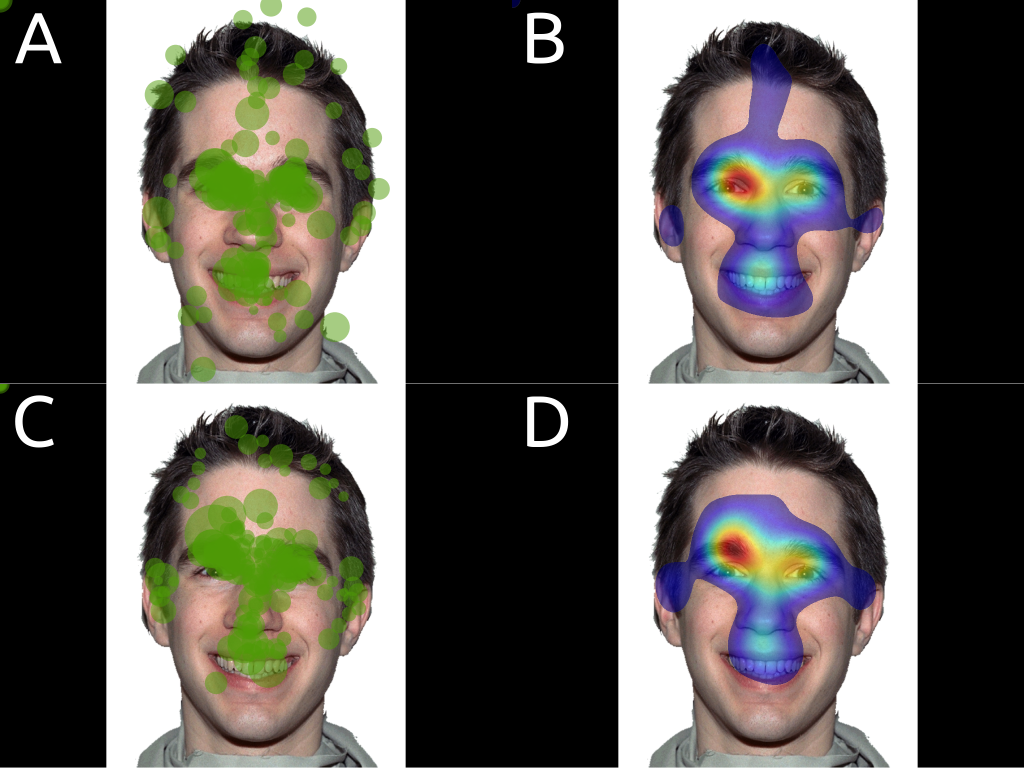
The previous test indicated that the EyeTribe is decent enough to accurately monitor fixations. One common psychological experiment is to show images to participants, and monitor where on those images they look. You can use this kind of experiment to see where in an image the participant’s attention goes out to.

Fixation plots (A and C) and heatmaps (B and D) the gaze behaviour of five participants measured using an EyeLink 1000 (A and B) and an EyeTribe tracker (C and D).
Obviously, this test is flawed: when participants see a face for the first time (with one tracker) they are likely to look at different things then when they see it for the second time (with another tracker). Because I randomised the order in which I used the two different trackers, this is less of an issue. But you still need to take this into account when looking at the fixation patterns. All you can really conclude from this, is that participants seem to roughly look at the same bits of the image, that both trackers can indeed capture this, and that PyGaze Analyser makes really cool data visualisations.
Pupillometry
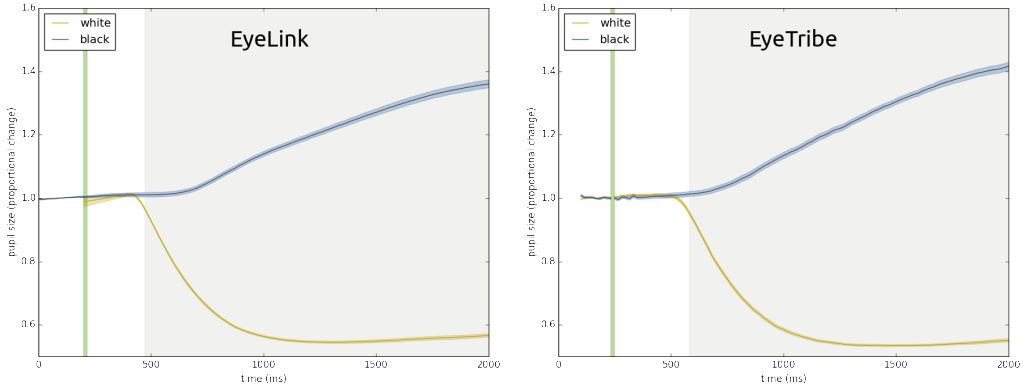
I tested the pupillary light reflex. The pupil responds to bright light by contracting (decreasing its size), and to a lack of light by dilating (increasing its size). In this experiment, I asked participants to look at a grey dot on the centre of the monitor while I changed the rest of the monitor from completely black to completely white every few seconds. This made the pupil contract when switching from dark to light, or dilate when switching from light to dark. There were 50 of these switches in total, thus 25 observations for each type of lighting.
I averaged the pupil size traces of every light-to-dark (blue in the graph) and every dark-to-light switch (yellow in the graph). The moment of switching is indicated by the green vertical bar. The average lines are represented in the graph as the solid lines. The standard error of the mean (an indication of the spread of all pupil traces) is represented as a shading around the averages. The grey background indicates when the pupil traces are different from each other, according to a very rigorous statistical test. This graph is from a single subject; you can find the rest of the graphs in a pre-print (link is at the end of this post).
In the graphs, you can see roughly the same things: pupils do indeed constrict when exposed to bright light, and dilate when there is little light. The robustness of this effect is amazing: look at how small those standard errors are! What is weird, is that the pupillary light reflex as measured with an EyeTribe seems to lag behind the one measured with an EyeLink a bit. I have no explanation for this (it’s unrelated to the shorter ‘tail’ of the EyeTribe graph: that’s due to fewer samples baseline period). Maybe the log messages were slower to appear in the log file, therefore some of the samples of after the screen change were attributed to before the screen change? I’m not sure, and I don’t have the equipment to test this in my current lab.
Saccadometry
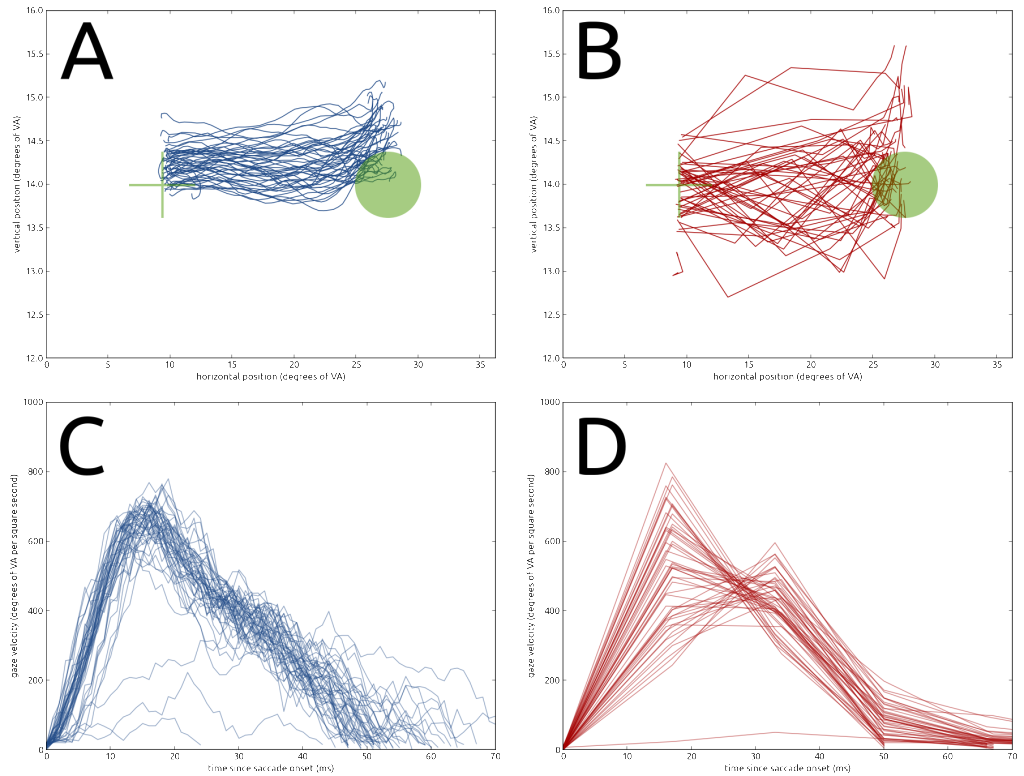
Saccades are quick movements of the eye. In this experiment, I made participants do 50 of them: all from left to right. Eye movements studies in the past have shown that saccade trajectories are never really straight: they curve as the eyes move from A to B. The amount of curvature changes with experimental conditions, thus it can be interesting to study saccadic trajectories. It can also be interesting to look at the velocity profiles of saccades. A velocity profile tells you how fast the eyes moved at what time in the saccade. These profiles are used to classify what parts of an eye movement recording are saccades, and which were fixations. In addition, there is emerging evidence that saccadic velocities actually change with experimental conditions as well. Hence, they are interesting to study.
Because the eyes move very fast during saccades, you need a high sampling rate to accurately measure them. The higher the sampling rate of your eye tracker is, the more data points you can obtain during a saccade, thus the more accurate your measurement is. Because the EyeTribe has a low sampling rate (only 60 Hz: 60 data points per second), it was expected to perform quite badly. (Keep in mind that the EyeLink records at 1000 Hz: 1000 data points per second!)
This is exactly what you see in the graphs. The upper row are saccade trajectories. They are recorded very nicely by the EyeLink (blue lines), but not so much by the EyeTribe (red lines). The sharp lines indicate that there are simply too few samples in each saccade to accurately describe its trajectory. The same is true for the velocity profiles (bottom row). The EyeLink describes these very nicely: the eye picks up speed at the start of the saccade, and then slows down again from around a third of the saccade’s duration until the end. Again, the EyeTribe fails to accurately test this. Curiously, if you would average all lines for each velocity plot, they would end up being relatively similar. So, in theory, if you measure A LOT of velocity profiles with an EyeTribe, their average would somewhat approach the average you get with a few EyeLink velocity profiles. (Don’t think of doing saccadometry with the EyeTribe, though, the data will never be good enough.)
Conclusion
The EyeTribe’s accuracy and precision are good enough to do proper fixation analyses with, provided you test in a perfect setup without interfering light and with a chin rest. The fixation patterns produced by the EyeTribe in an Area-Of-Interest analyses match the patterns you would expect based on recordings with an EyeLink 1000. The pupillary light response as measured with an EyeTribe closely matches the EyeLink 1000 recording, although there does seem to be a bit of a lag in the EyeTribe compared to the EyeLink data. Saccade trajectories and velocity profiles look absolutely awful when tested with an EyeTribe, due to its low sampling rate.
If are unable or unwilling to invest in an expensive piece of equipment, the EyeTribe might be for you. You would likely be able to use it in studies of fixation patterns, or simply to check if participants fixated in a study that requires them to look at a (central) point while covertly attending to peripheral stimuli. You might also be able to use it in studies of pupil size effects.
Do not use the EyeTribe if you want to investigate the properties of saccades, even if it’s their latencies (these are often used as an index of reaction time). The low (60 Hz) sampling rate is simply not enough to capture enough data points within a saccade, and it will introduce a large measurement error in saccadic latencies (so large that it will completely obscure any potential effects).
Pre-print
All of the results mentioned here are from a pre-print of a paper that I submitted to a peer-reviewed journal. The pre-print can be found on PeerJ PrePrints. Keep in mind, though, that it has not completely gone through the process of peer review yet!
To be honest, I kind of dropped the ball on this one after a stupendously long review #2, with LOTS of irrelevant details. I did not have the time to reply and respond, so the manuscript is currently collecting dust in my TODO pile… If you read this and have an EyeTribe and some time, you are very welcome to run a comparison study (the scripts are on my GitHub page) between the EyeTribe and some other device. I would welcome any co-authors on the study!


Hello,
I am working with very young students and we need to track the attention levels of the kids. We are showing them videos on a 21 inch screen monitor from a distance of 60-80 cms.
We are using raspberry pi 2 for this. I would like to know if we could use your products to see the spots viewed by students on each video.
I would appreciate if you could help me with this.
Best Regards,
tj
Dear TJ,
An important note: these are not my ‘products’. The tracker I talk about is manufactured by the EyeTribe. My software is all open source, and not a product: It’s free to grab and modify.
Unfortunately, the EyeTribe do not offer Linux support. So I’m afraid it will not work on Raspberry Pis. You’ll probably have to code a custom solution yourself.
Good luck!
Edwin
Thank you for a good overview comparison between these two eye trackers. I have been looking into the EyeTribe (due to its low cost) for use in an ophthalmological experiment at our department, however, I was disappointed when realizing it does not output any uncalibrated data which our study would require. I believe your data is after calibration. Do you have any idea if it is possible to go around the calibration at all? Is there any way to trick the system to think it is calibrated perhaps?
Keep up the good work,
P
Ophthalmologist, Lund University, Sweden
Thanks, P!
This is a problem in a lot of modern video-based eye-trackers, unfortunately. I’m afraid the EyeTribe won’t give you much without a calibration profile. Where do you need the uncalibrated data for?
At your university, Kenneth Holmqvist and Marcus Nystrom are experts in eye tracking, with an impressive collection of devices (and technical knowledge!). They might have a solution, or perhaps know of a different tracker that could suit your purposes. I would highly recommend contacting them; it might lead to a good info, a nice tour of their lab, and perhaps a collaboration.
Good luck!
HI,
DID YOU THOUGHT ABOUT COMPAIRING BOTH EYETRIBE AND THE TRACKER YOU SELF MADE FROM THE WEBCAM? ALSO DO YOU HAVE MORE DATA ABOUT WEBCAM TRACKING? HOW GOOD IS IT ETC?
WOULD ALSO LIKE TO SAY YOU DID SOME IMPRESIVE WORK HERE
IDO.
HI,
THANKS FOR YOUR RESPONSE, AND THE COMPLIMENT!
I DID NOT COMPARE THE EYETRIBE WITH THE WEBCAM THING, BECAUSE THAT WOULD BE IMPOSSIBLE… THE EYETRIBE IS AN ACTUAL EYE TRACKER THAT CAN DO FANCY GAZE TRACKING, AND MY WEBCAM THING JUST TRACKS PUPIL LOCATION AND SIZE. SO IT’S NOT ACTUALLY USABLE FOR MOST PURPOSES.
CHEERS,
EDWIN
Hi,
Thanks for all of the extremely helpful info. I see that you did a 9 point calibration. Is the calibration pretty quick & easy? Our study involves adolescents with ASD, and I don’t want to add anything too tedious to my already tedious (for them) experimental paradigm.
Thanks! The calibration is pretty quick; you should be able to do it within 30 seconds (provided your participants actually look at the calibration targets!).
Good luck!
Hello, after reading this extremely helpful post (thanks!) I’m wondering if you know about a low cost eye-tracker that would work on linux, our university has an open source policy (i.e. no windows) and the one I know would work on linux is not affordable for us (pupil-labs)
Thanks for any information!
Thanks! Very interesting to learn that there are universities with such a policy! Would you mind disclosing what uni that is?
As for Linux support: The only tracker I’ve ever used from Linux (Ubuntu 10.04 at the time) was an EyeLink 1000, and that wasn’t the best experience ever. Needed to downgrade Java, and the connection wasn’t reliable. As for the EyeTribe: People have been pestering them to support Linux since they’ve started selling their first model. However, last time I checked it wasn’t there yet. I’m not sure what the problem is. They already support Mac, which shouldn’t be too different from most Linux versions (as far as I understand it). And Ubuntu is an increasingly common platform, especially among researchers. Perhaps their focus is on the commercial market? (And even then: Android has a massive market share, and shouldn’t be too different from desktop Linux.)
You could probably help the case by writing to them, to explain your situation. I’m sorry I can’t offer any advice beyond that…
Hello, thanks for your reply. We are at the national university in Córdoba, AR. Do you have any opinion about or experience with the pupil-labs product?
In the worst case we would have to use notebooks with windows …
best,
Paula
Great article.
Great analysis.
sorry for the reviewer #2, the community would need your work so much.
Hello, I am a psychology student and I am working on saccade eye movements of video game players and ADHD patients. I would like to ask if EyeTribe tracker can be of some help because I need to record the saccade reaction times and errors.
Sounds like a cool project! I’m afraid you might run into two issues with the EyeTribe: For starters, the company was bought by Facebook and has stopped producing eye trackers for us humble mortals. (For more info, see my other blog post, or this one by Sebastiaan Mathot.)
The second reason is more important, because it also extends to potential alternatives to the EyeTribe: The sampling rate of cheap eye trackers is not high enough to accurately measure saccadic parameters. You might be able to find out the endpoint accuracy (as a saccade to the wrong point is usually followed by a brief fixation there, or at least a measurable slowing of the eye), but there is simply too much variability on the measurement of saccadic starts to compute reliable saccadic reaction times. If you need those, you’re going to need a bigger boa… errr… tracker. That is: with a sample rate of at least 250 Hz, and preferably a lot higher.
Sorry for the disappointing answer! Sometimes there is no other way than dishing out more money, or having to go back on your initial idea and find a work-around. (For example: Could you do the same game with just fixation accuracy and manual response times?) Good luck!
what a dishonest company (EyeTribe). I don’t think they ever wanted to release the product and it was a scam. I bought their product in May 2016 and it never arrived. They didn’t even bother to refund me! Now, you cannot even contact them. Their number is invalid and if you email them, you receive an automatic reply.
hello
i m actually working on making an Eye-tracking project for my university, and i don’t know how to get the gaze-plots, can you please help me, knowing that i laready have the data rows
Hi Edwin,
Very interesting research! Now I am using EyeTribe to capture the pupil diameter and gaze fixation duration. Could you give some detailed tutorial about how to get the fixation plot, heatmap and so on?
Thank you very much,
Hi, I am reviewer 2, every paper ever submitted should not be published. Kindest regards.
I’m looking into a lot of different eye trackers and software solutions. What’s the difference between this system and a purchased one like those from https://imotions.com/eye-tracking?
Hi Chris,
I don’t know iMotions, but judging from your link they merely act as a reseller of other brands of eye trackers. As far as the software solutions go: The above describes open-source software, which comes as-is, and with limited support (it depends on volunteers). Commercial solutions often come with more support, but in general they tend to be less flexible, and obviously they are more expensive. (Again, though, I don’t know imotions, so have no clue about their software.)
Cheers,
Edwin
Hi,
just a short question.
What’s the model number of this eye tracker?
I want to buy it on eBay and I don’t know which one is right.
Thanks in advance!!!
Pingback: The $100 EyeTribe tracker – Quantitative Exploration of Development (Q.E.D.)